Volatility and cryptocurrency go hand in hand. The cryptocurrency market thrives on speculation. Investors bet that the prices would go up or go down to make profits. These speculative bets cause a sudden influx of money or a sudden outgo, leading to high volatility.
Cryptocurrency traders are always using the options market to bet that prices on digital assets such as Bitcoin and ether will soar ? or crater. A lesser-known use for options trading is simply to bet on whether price swings or volatility will increase or decrease.
In today’s blog, we’re going to dive into the basics of volatility trading and its strategies on how to leverage this drawback of crypto to our advantage! Let’s get started.
What is Volatility?
Table of Contents
Volatility is a natural part of market activity.
Volatility in crypto or any financial market refers to changes in the price of an asset. It can be healthy, with steady increases or decreases in price within a general range. And it can also be extreme, with sudden price movements in either direction.
Healthy volatility serves many purposes in a market, but it mainly creates profit opportunities. Thus, it becomes vital to understand the concept of healthy volatility and how to harness its profits.
Understanding Healthy Market Volatility
Extreme volatility often has a negative connotation as many people associate volatility with market chaos, uncertainty, and loss.
When markets swing between extreme highs and lows, investors and traders may place more bets predicting continued swings, which in turn causes more price volatility. The good news, however, is that such instances of extreme price volatility are rare. What we see in crypto markets daily is moderate, or healthy volatility.
With this type of volatility, price movements occur as investors and traders respond to information and news developments about companies, industries, and the broader macroeconomic sentiment. Traders assess market conditions and buy or sell assets accordingly, based on how they think the factors at play will affect prices.
Historical vs. Implied Volatility
Volatility can either be historical or implied; both are expressed on an annualized basis in percentage terms.
- Historical volatility (HV) is the actual volatility demonstrated by the underlying over a period of time, such as the past month or year.
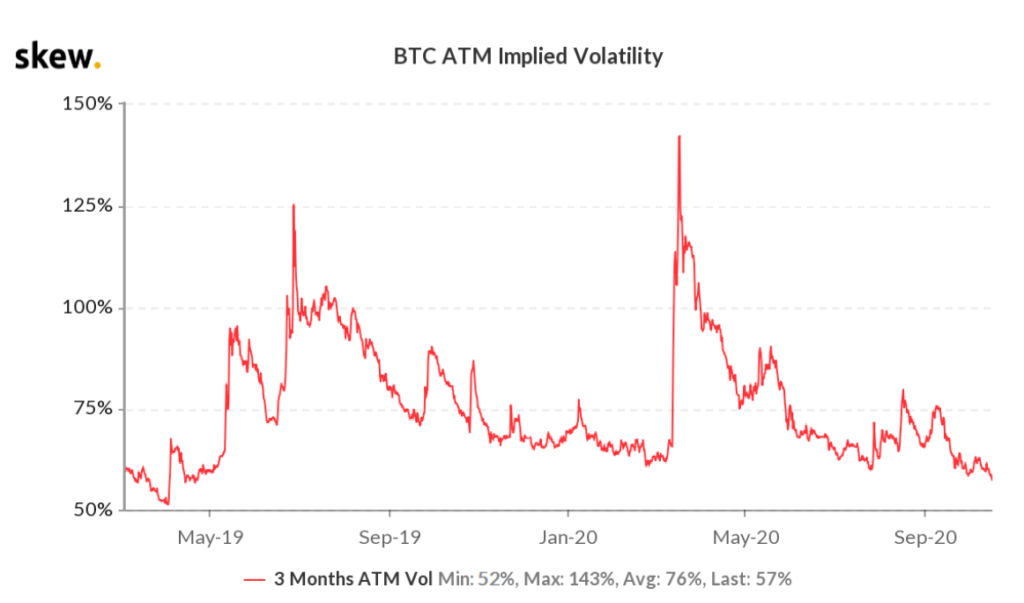
- Implied volatility (IV), on the other hand, is the level of volatility of the underlying that is implied by the current option price.

3-month options contracts implied volatility. Source: Skew
Implied volatility is far more relevant than historical volatility for options pricing because it looks forward. But it should be kept in mind that while the levels of historical and implied volatility for a specific asset can be and often are very different, it makes intuitive sense that historical volatility can be an important determinant of implied volatility.
Now that we’ve covered the basics, more or less, let’s see how to trade it.
Trading Volatility
Volatility is an important metric for every trader, including short-term day traders and swing traders, whose primary focus is on daily and weekly price movements.
By having a good grasp of volatility, you can create appropriate trading strategies that help to harness profit potential. This can be achieved by trading volatile assets, tracking changes in volatility to aid in selection, incorporating volatility-based technical indicators or software, or focusing on low-volatility assets.
Let’s see what are some of the volatility trading strategies!
Volatility Trading Strategies to Make Profit
Volatile Assets for Day Trading
A volatile asset is one whose price fluctuates by a large percentage each day, especially with a lot of volumes, implying that a trader can enter and exit the position easily. This is one reason why volatile coins are so popular for day trading, in particular.
For example, when day trading volatile assets, you can set up a five-minute chart and wait for a short-term trend to develop. You should then wait for a consolidation, which is at least three price bars that move mostly sideways, and enter the position if the price breaks out of the consolidation in the trending direction.
Volatility Breakout Trading Strategy
A breakout happens when the price of an asset moves beyond?support and resistance levels?on a trading chart, which indicates a new trend direction.
One way to measure volatility breakouts is through technical indicators, such as the Average True Range (ATR), which tracks how much an asset typically moves in each price candlestick. A sharp rise in the ATR can alert traders to potential trading opportunities, as it most likely indicates that a strong price movement is underway and there will be a breakout.
Only when the ATR crosses above the simple moving average is there a potential trade.
With these strategies, you can ensure maximum profit potential when trading in the crypto market. This blog, however, by no means should be taken as financial advice.
Volatility Trading Indicators
As we mentioned above ATR is a particularly effective tool for tracking how much an asset is moving, on average, for each price bar. Other than that, we’ve listed a few metrics below that are helpful as well.
- Implied Volatility.
- Historical Volatility.
- The Relative Volatility Index (RVI) is another indicator that analyses the direction and volatility of the price.
- BitVol (Bitcoin Volatility) and EthVol (Ethereum Volatility) Indexes.
More on BitVol and EthVol
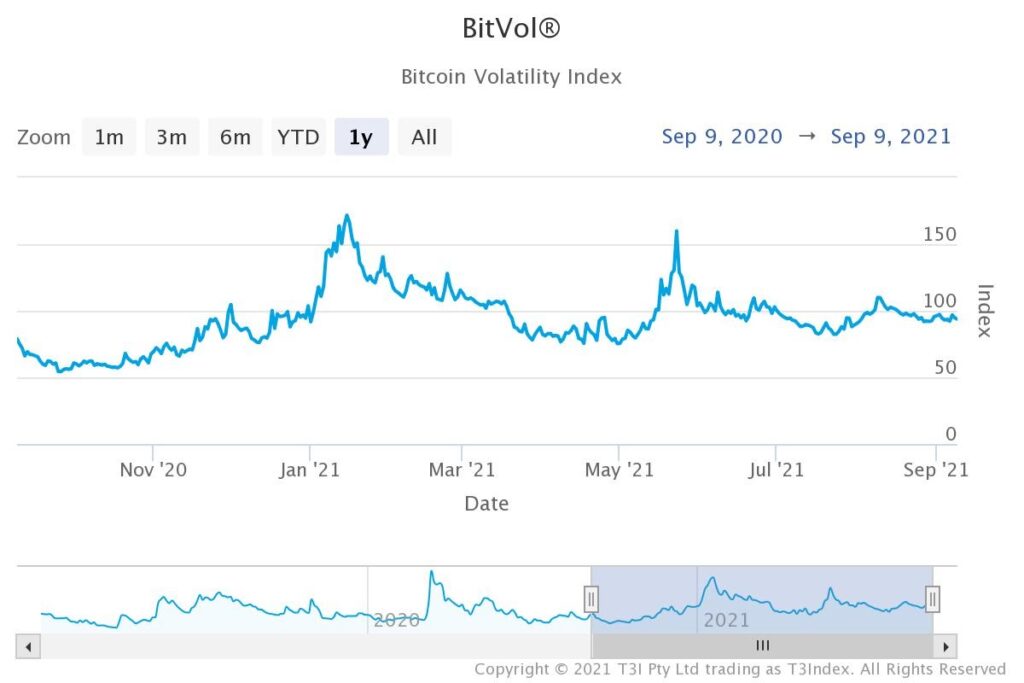
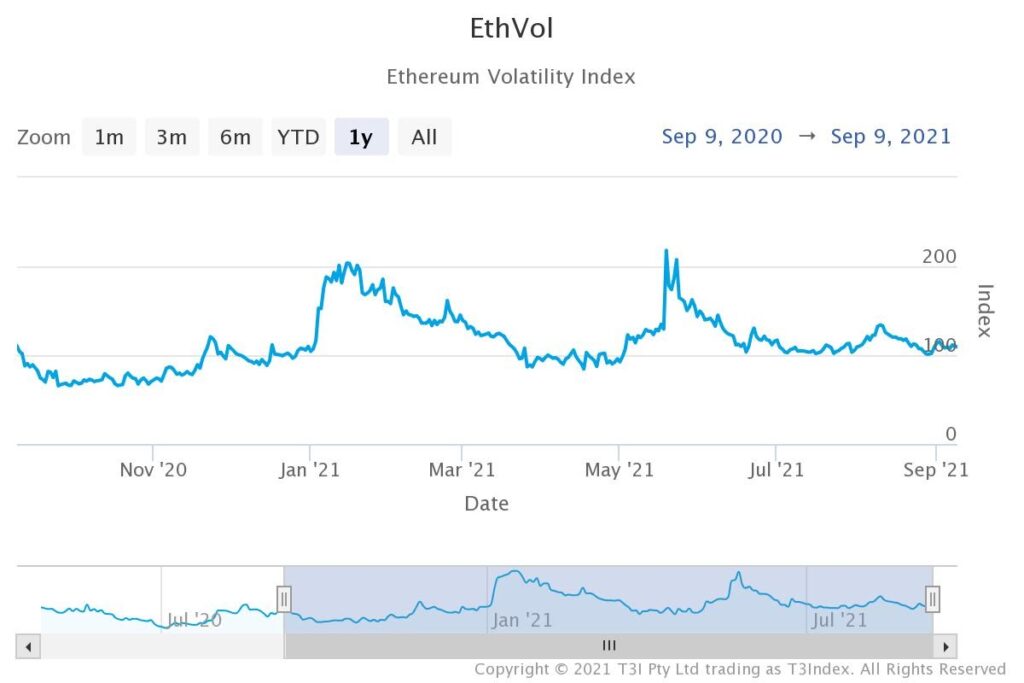
The BitVol and EthVol Indexes are a measure of expected 30-day implied volatility in BTC and ETH, respectively. The index offers cryptocurrency investors the ability to trade volatility as a distinct asset class.
Below are the charts for a better understanding of BitVol.

- The BitVol index has settled around an annualized 100% after reaching a high near 170% on January 15, which preceded a roughly 20% price correction in Bitcoin.
- Elevated volatility could be a signal of investor fear or uncertainty, while low levels of volatility signal investor complacency.

Similarly, EthVol works for Ethereum.
So, now we know what to do when the crypto market is volatile. But what about when the market is relatively stable?
What to do When the Volatility is Low?
Trading volatile markets and price movements do not appeal to all traders. Most long-term investors prefer markets to be quiet.
However, day traders can take advantage of low volatility by acting like a market maker ? someone who provides buy and sell orders when needed to help create a liquid market. They make their money by buying lower and selling at higher prices throughout the day.
Final Thoughts
Trading volatility is a great way to find profitable trading opportunities in the market without being right in the direction of the price. Volatility often occurs after important market reports, especially if the published number doesn’t match market expectations.
Trading is exciting, undoubtedly but one must always be cautious and do it in moderation. Volatility trading has the potential to provide big rewards when using leverage, but also big losses. Always have a backup and assess all risks and pitfalls that could be there before diving all in.
Disclaimer: This article is only to be considered educational and by no means is this financial advice. Kindly do your own research and proceed ahead.
About Us
ImmuneBytes is facilitating blockchain security by employing the use of cutting-edge techniques on smart contracts and decentralized applications. We have a team of experienced security professionals who are adept at their niches and provide you with innovative solutions and consultation. So far we have worked on 175+ blockchain start-ups on different blockchain frameworks, with clients spread across the globe, and are continually unfolding ourselves to make this decentralized movement thrive.
To learn more about the decentralized world visit our ImmuneBytes blogs

